When a website claims "your data never leaves your device," how do you know if that's actually true? The answer is simpler than you might think: every modern browser has a built-in tool that shows you exactly what data is being sent over the internet.
This guide will teach you how to use your browser's Network Inspector to see the truth for yourself. Whether you're evaluating a new AI tool, checking a privacy-focused service, or just curious about what your browser is doing behind the scenes, this skill will serve you well.
The Network Inspector shows every piece of data your browser sends or receives. If a tool claims to process your files locally, you can verify this by checking for upload requests—if there are none, your data truly stayed on your device.
What is the Network Inspector?
The Network Inspector (also called the Network tab or Network panel) is part of your browser's Developer Tools. Don't let the name intimidate you—you don't need to be a developer to use it. Think of it as a security camera for your internet connection: it records every request your browser makes to outside servers.
When you load a webpage, your browser makes dozens of requests: fetching images, stylesheets, fonts, and data from servers. When you upload a file to a service like ChatGPT or Google Docs, that upload appears as a request too. The Network Inspector captures all of this, showing you what was sent, where it went, and how much data was transferred.
How to Open the Network Inspector
The process is nearly identical across all major browsers. Here's how to access it:
| Browser | Keyboard Shortcut | Alternative Method |
|---|---|---|
| Chrome | F12 or Ctrl+Shift+I | Menu → More Tools → Developer Tools |
| Firefox | F12 or Ctrl+Shift+I | Menu → Web Developer → Network |
| Safari | Cmd+Option+I | Develop menu → Show Web Inspector |
| Edge | F12 or Ctrl+Shift+I | Menu → More Tools → Developer Tools |
On Mac, replace Ctrl with Cmd. For Safari, you may need to enable the Develop menu first: go to Safari → Preferences → Advanced → "Show Develop menu in menu bar."
Step-by-Step: Checking What a Website Sends
Let's walk through the process of monitoring a website's network activity when you upload a document.
Open the Network Inspector first
This is important: open DevTools before you interact with the page. The Network Inspector only records activity that happens after it's opened. Press F12 and click the "Network" tab at the top of the panel.
Clear any existing activity
Click the clear button (a circle with a line through it) to start fresh. This removes any requests from page load so you can focus on what happens next.
Filter for relevant requests
Click "Fetch/XHR" in the filter bar. This is important: websites load dozens of JavaScript files, stylesheets, and fonts just to display the page—but these aren't your data. The Fetch/XHR filter shows only data requests: API calls, file uploads, and content submissions. This is what you actually care about.
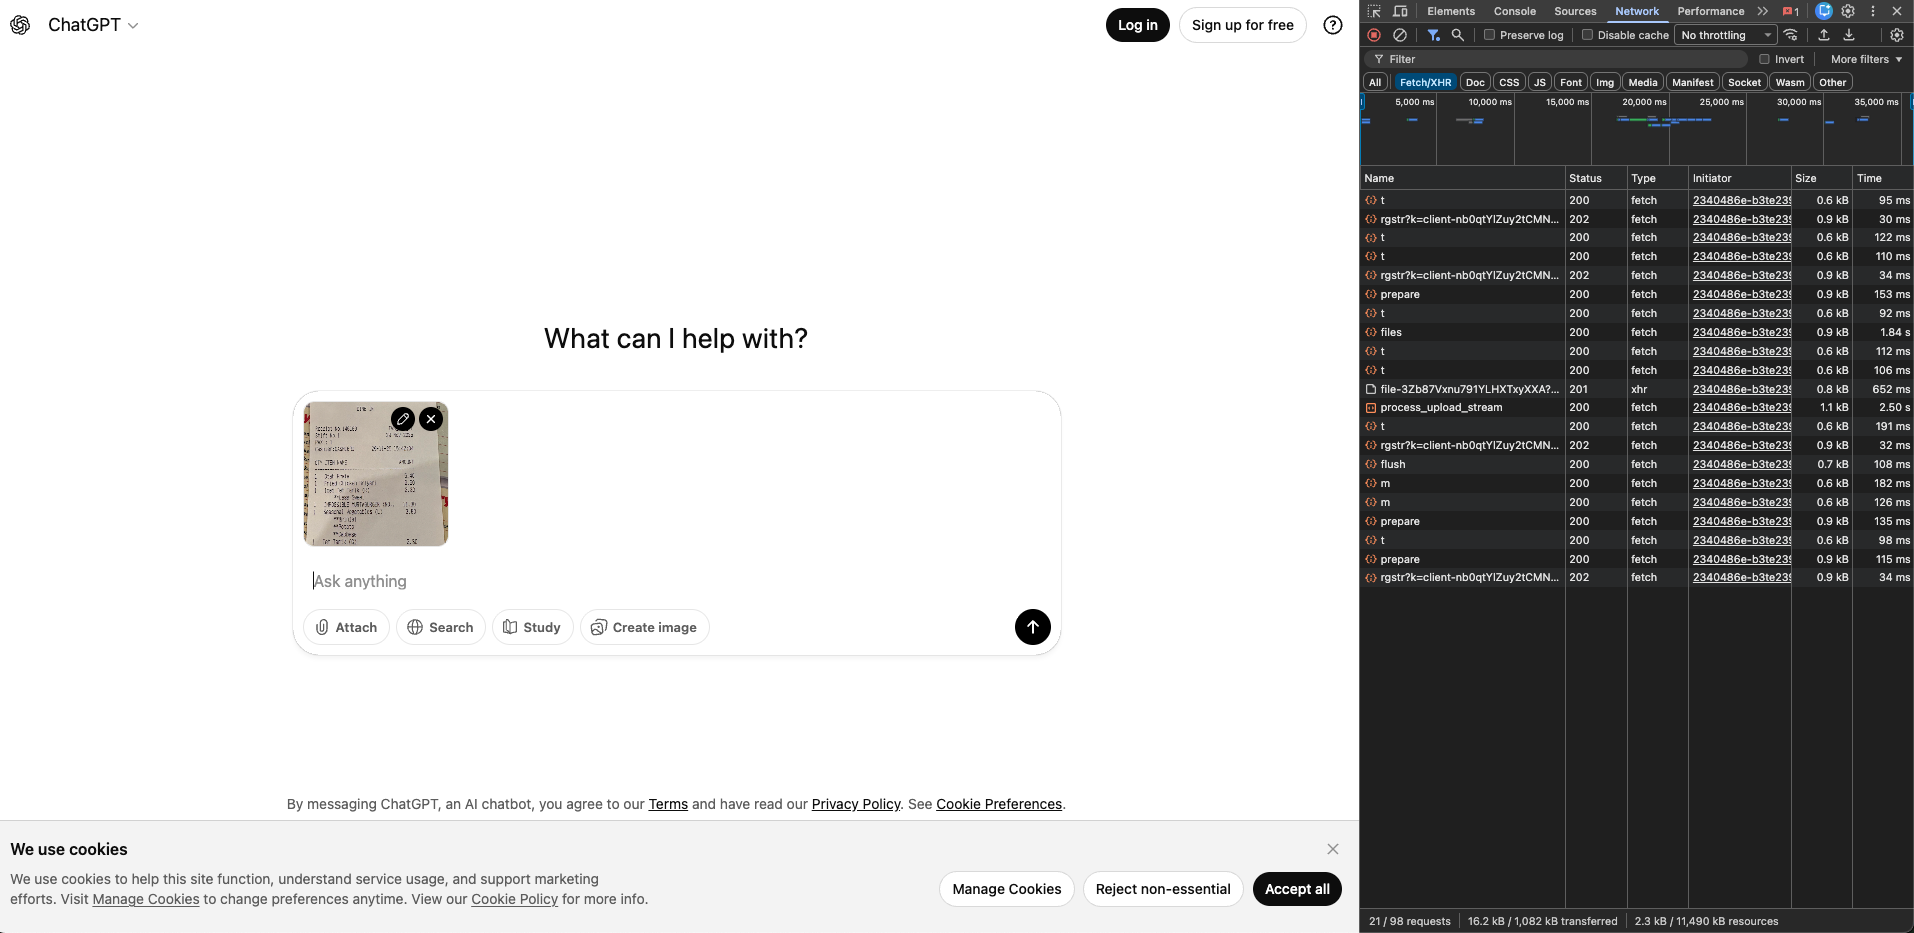
process_upload_stream and files—these indicate your file was sent to servers.Perform your action
Now upload your file, paste your text, or do whatever action you want to monitor. Watch the Network panel—if data is being sent to servers, you'll see requests appear in real-time.
Analyze what you see
Each row in the Network panel represents one request. Look at the "Name" column to see what was requested, and "Size" to see how much data was transferred. Requests with names like upload, process, files, or stream are strong indicators that your content is being sent to servers.
Dig into the details (the smoking gun)
Click on any suspicious request to open a details panel. Then click the "Payload" tab to see exactly what was sent. This is where you find the smoking gun—undeniable proof that your file was transmitted.
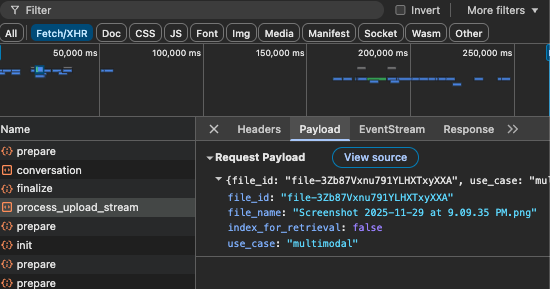
process_upload_stream payload reveals your actual filename (Screenshot 2025-11-29 at 9.09.35 PM.png) and a server-assigned file_id. Your file now exists on OpenAI's servers.This is the evidence that matters. Seeing your filename in the server's response proves your document was uploaded and stored. The server has assigned it an ID (file-3Zb87Vxnu...) for processing—there's no ambiguity about where your data went.
Don't be confused if this request shows a small size (like 1KB). The actual file bytes are often uploaded through separate streaming requests. What matters is what you see here: your filename is now on their infrastructure.
What to Look For
When analyzing network activity, here are the key indicators that your data is being sent to external servers:
Signs your data IS being uploaded
If you see requests with names like upload, process, files, or completion after you upload a document, your data is being sent to servers. The request names are usually descriptive—process_upload_stream means exactly what it sounds like.
Signs your data is staying local
If the Fetch/XHR filter shows zero requests (or only authentication/session requests that don't contain your content), your data is being processed locally. Some tools may show a few small requests for things like usage analytics or license verification—but if your actual document content isn't in any payload, it stayed on your device.
Understanding What You See
Here's a quick reference for interpreting common request types:
| What You See | What It Means |
|---|---|
upload-file, upload_stream |
Your file is being sent to their servers |
completion, chat |
Your text/prompt is being sent for AI processing |
analytics, telemetry |
Usage data (usually not your content) |
auth, session |
Login/authentication (not your content) |
| Zero Fetch/XHR requests | No data sent—processing is local |
Pro Tips for Privacy Verification
Understand the "All" vs "Fetch/XHR" difference
If you click "All" instead of "Fetch/XHR," you'll see hundreds of requests—but don't panic. Most are JavaScript files, stylesheets, and fonts that the website needs to function. These aren't your data; they're the website's code. The Fetch/XHR filter cuts through the noise to show only data requests. That's where your uploaded files and text content would appear.
Test with a recognizable file
When testing a service, use a document with unique, searchable text (like "PRIVACY_TEST_12345"). If you find this string in any network request payload, you know exactly what was sent.
Check the "Preserve log" option
Enable this checkbox in the Network panel to keep requests visible even if the page reloads. This ensures you don't miss anything.
Look at request sizes
If you upload a 1MB document and see a request of similar size, that's a strong indicator your file was transmitted. Local-only tools will show minimal or zero data transfer for your content.
Test offline
The ultimate test: disconnect from the internet and try again. If the tool still works, processing is genuinely local. If it fails, it requires server communication.
Frequently Asked Questions
See This Technique in Action
Want to see what happens when you use this Network Inspector technique to compare real AI tools? We tested ChatGPT, Claude, and PromptSafe with the exact same document.
Read the AI Privacy Comparison →Conclusion
The Network Inspector transforms "trust us" into "verify it yourself." In an era where data privacy claims are everywhere, having the ability to independently verify those claims is empowering. The next time a service promises that your data stays private, you now have the tools to check.
This simple skill—opening DevTools and watching the Network tab—can inform better decisions about which tools you trust with sensitive information. Whether you're handling confidential business documents, personal information, or just value your privacy, five seconds of verification is always worth it.